
I Went Hunting for the Famous loss.item() Tax and Came Back With Pocket Change
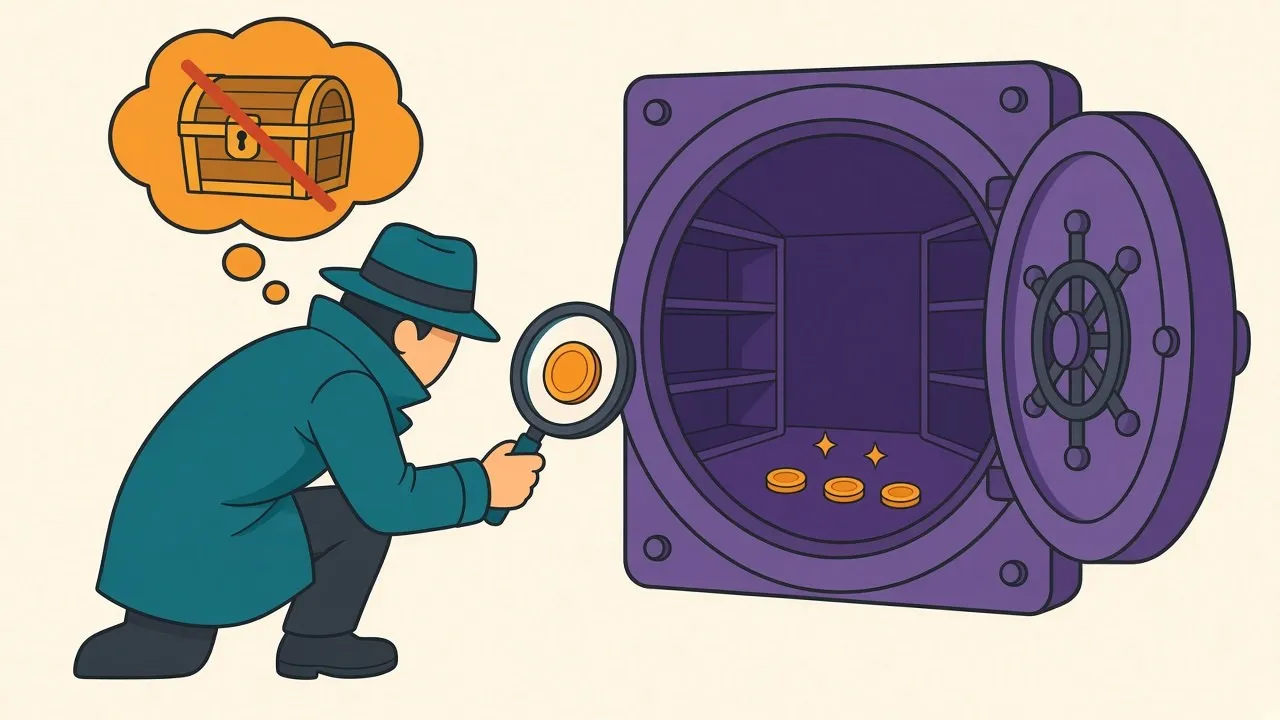
There’s a piece of PyTorch advice I’ve repeated without measuring, which recent history suggests is exactly the kind I should test: don’t call loss.item() every step — it forces a GPU synchronization and kills your pipeline. It appears in performance guides, code reviews, and at least one of my own old commit messages. The claim has a solid mechanistic core: PyTorch queues GPU work asynchronously, .item() makes the CPU stop and wait for the queue to drain, and stalling the dispatcher every step sounds expensive. Today I tried to measure how expensive — and mostly failed to find the crime scene.
Five attempts to make the tax appear
All runs on GPU-resident synthetic data, so the DataLoader can’t hide anything; 300+ steps per config, best of repeated passes. First, eager mode, small and large models:
| logging style | SmallResNet (5.5 ms steps) | ResNet50 (121 ms steps) |
|---|---|---|
| nothing (sync once at end) | baseline | baseline |
loss.item() every step | +1.4% | 0% (noise) |
.item() every 10 steps | +0.7% | 0% |
GPU-side accumulation, one .item()/epoch | +0.1% | 0% |
| bare tqdm bar | +0.2% | 0% |
tqdm + set_postfix(loss=...) | +5.2% | 0% |
For the big model the tax is unmeasurable — every variant lands within run-to-run noise. For the small model, the famous sync costs about one percent, and the only line that clears 5% is set_postfix, whose cost is mostly doing string formatting 180 times a second, not synchronizing.
So I escalated. Sub-millisecond steps, where a fixed sync cost should hurt proportionally most — a tiny four-layer MLP at 0.71 ms/step, the reinforcement-learning regime: .item() every step costs +3.8%. Then torch.compile, including reduce-overhead mode with CUDA graphs, where a mid-loop sync should be maximally rude: +5.0% (and +7.4% with the default backend, the worst number I managed to produce all afternoon). That’s the entire haul. The advice implies double-digit destruction; five regimes of trying produced a worst case of seven percent and a typical case near two.
Why the horror story doesn’t reproduce
The mechanism turns out to be self-limiting, from both directions. When steps are tiny, the loop is CPU-dispatch-bound — the GPU finishes each kernel before the CPU can queue the next, so the queue is always nearly empty and draining it costs almost nothing. When steps are big, the queue is deep, but .item() merely waits for work that had to run anyway; the true waste is only the bubble while the CPU re-fills the pipeline afterward, a few tens of microseconds against a 121 ms step. The tax would need a middle regime — deep queues and fast steps and a slow dispatcher — to bite the way the folklore describes. On a modern desktop CPU feeding a modern GPU, that regime is thin.
Where did the folklore come from, then? Partly from real but different sins that ride along with logging: printing to an actual console every step (catastrophically slow on some terminals), flushing TensorBoard writers per iteration, computing extra metrics on the GPU and .item()-ing each one separately. Partly from environments where the claim is genuinely true at scale — XLA/TPU, where a host roundtrip can trigger recompilation, and distributed training, where one rank’s stall becomes everyone’s stall (untested here, and I’d expect the tax to multiply). And partly, I suspect, from the era of slower CPUs, when the dispatch bubble was fatter relative to everything else. The advice, as usual, shipped without its context attached.
What I’ll actually do differently
Almost nothing — which is the finding. loss.item() per step stays in my loops; the readable version of the code costs one to four percent on small models and nothing on large ones, and readability wins at that price. The two changes worth making: set_postfix on every iteration of a fast loop gets replaced with a postfix update every 50 steps (its 5% was the biggest legitimate line item on the board), and for the rare loop where every percent matters, the GPU-accumulation pattern — loss_sum += loss.detach(), one .item() per epoch — measured genuinely free.
Scope: one machine, one very fast CPU, no distributed, no TPU; if your trainer runs on eight ranks or XLA, the folklore may still be law there. But for the single-GPU case where this advice gets dispensed most freely — code reviews of student projects and desktop experiments — the famous tax is pocket change, and the real money was in the input pipeline all along. It took an afternoon and five regimes to fail to confirm a claim I’ve repeated for years. That ratio — years of repetition, one afternoon to check — is the recurring arithmetic of this blog.