Latest Posts

EMA's Decay Isn't a Dial. It's a Plateau, a Cliff, and a 10%-Accuracy Crater

EMA's Decay Isn't a Dial. It's a Plateau, a Cliff, and a 10%-Accuracy Crater

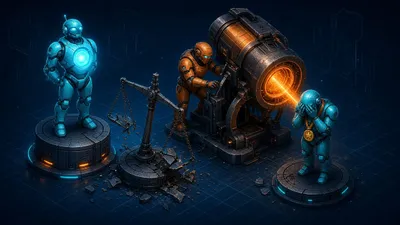
A month ago EMA's tutorial default lost me three points and the tuned value earned a cosmetic +0.08, so I did what this blog now does to every knob: swept the whole curve. Six decay values tracked as parallel shadows inside the same ten training runs — perfectly paired, zero extra GPU time per arm. The result isn't a curve with an optimum. It's a flat shelf where every reasonable value pays the same +0.1, a cliff edge between 0.995 and 0.999, and at the far end a shadow model that evaluates at coin-flip accuracy.


When the Gyroscope Dies, My Activity Model Loses 3 Points. The Gyro Was Only Worth 1

When the Gyroscope Dies, My Activity Model Loses 3 Points. The Gyro Was Only Worth 1

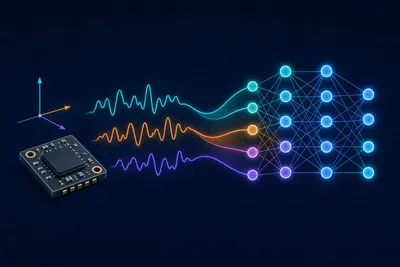
Sensors fail in deployed wearables — gyros get power-gated to save battery, drivers hang, cheaper SKUs ship without them. Fifty paired splits of sensor-failure accounting: an unprepared model loses 2.8 points when the gyro flatlines, yet a model trained without gyros entirely only trails by 0.9 — meaning two-thirds of the crash is distribution shock, not missing information. Channel-dropout training buys the difference back for a 0.3-point premium.

One Scalar Fixed My Model's Overconfidence. It Needed 500 Labels to Find

One Scalar Fixed My Model's Overconfidence. It Needed 500 Labels to Find

The calibration series ends with the repair tool: temperature scaling, fitted and measured on both of my broken models — the vain one claiming 92 while scoring 89, and the label-smoothed one lowballing itself by six points. One fitted number cut the first model's calibration error to a third with accuracy provably untouched, fixed only two-thirds of the smoothing damage, and — answering the objection my own early-stopping post raised — needed just 500 validation samples to find.

All of Label Smoothing's Accuracy Arrives at 0.02. Everything After That Is Damage

All of Label Smoothing's Accuracy Arrives at 0.02. Everything After That Is Damage

Yesterday ended with smoothing 0.1 improving my model while wrecking its probabilities, and an obvious question: is there a dose that keeps the gain without the wreckage? The five-point sweep answers cleanly — the accuracy benefit saturates at the smallest dose I tried, calibration is a strictly monotonic casualty after its sweet spot, and the folklore that smoothing improves calibration turns out to be true at exactly one point on the curve. It just isn't the point everyone copies.

Label Smoothing Made My Model Better and Its Probabilities Worse

Label Smoothing Made My Model Better and Its Probabilities Worse

Yesterday I promised not to over-interpret why label smoothing paid 3x more under Adam, and proposed a tidy hypothesis to test: Adam's overconfident logits give smoothing more to fix. The dedicated experiment killed the hypothesis in one table — and handed back something better: label smoothing tripled my calibration error, trading mild overconfidence for severe underconfidence while improving accuracy. If anything downstream consumes your model's probabilities, that's not a detail.
How Many Seconds of Sensor Data Does Activity Recognition Actually Need?

How Many Seconds of Sensor Data Does Activity Recognition Actually Need?

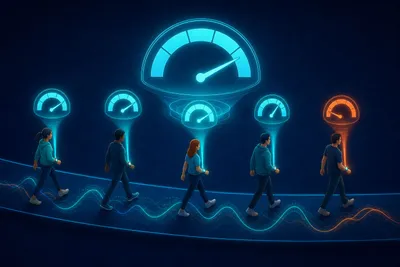
The standard HAR window — 2.56 seconds, 128 samples — is a benchmark convention nobody questions, and every real-time system inherits its latency. Center-cropping the windows across 50 paired subject splits: a quarter of the context costs 0.87 points overall, the dose-response curve steepens with each halving, and as usual the bill lands hardest on the worst-served subjects.

I Stacked Every Win From This Month's Experiments. The Stack Held.

I Stacked Every Win From This Month's Experiments. The Stack Held.

A month of paired t-tests produced a shelf of small verified wins — Adam, label smoothing, EMA, flip-TTA — each measured alone. The obvious risk: improvements that overlap, fixing the same failure twice and paying twice for one gain. So, the stacking test: three arms, five seeds, TTA on top of everything. Verdict: nearly perfect additivity, one pleasant super-additive surprise, and a baseline that has now climbed 1.9 points without touching the architecture.

The GPU Has a 0.8 ms Floor, and My Sensor Model Lives Under It

The GPU Has a 0.8 ms Floor, and My Sensor Model Lives Under It

Head-to-head serving latency for four model sizes on CPU (ONNX Runtime) versus GPU (PyTorch fp16, copies included): at batch 1 the tiny IMU model runs 11.7x faster on CPU, because a GPU inference can't cost less than its launch-and-copy overhead no matter how small the network is. One batch dimension later, the GPU wins everything by up to 62x. The crossover is sharp, cheap to measure, and worth real money.

The LR Schedule Was Worth 5.7 Points. The Fancy Curve Was Worth 0.3

The LR Schedule Was Worth 5.7 Points. The Fancy Curve Was Worth 0.3

Yesterday I confessed to never sweeping the optimizer; today, its accomplice. Cosine annealing has been in every experiment this blog has run, chosen by the same reflex. The face-off — constant, step, linear, cosine at the fixed 10-epoch budget — says the reflex was right but for an inflated reason: having any decay is the biggest effect I've ever measured, the specific curve is nearly cosmetic, and the schedule turns out to be what was manufacturing my low noise floor all along.

ONNX Runtime's Optimization Levels Do Completely Different Things to Different Models

ONNX Runtime's Optimization Levels Do Completely Different Things to Different Models

Everyone leaves ONNX Runtime's graph optimization at the default and moves on — reasonable, but it hides where the speed actually comes from. Measured across my three models: the int8 network is a 3.4x win that collapses to a pessimization if optimization is off, ResNet18 gets 35% from layout transformation and almost nothing from operator fusion, and at the 0.05 ms scale I briefly 'discovered' a regression that evaporated on re-measurement.

The One Knob I Never Swept Was the Optimizer. Adam Beat My Tuned SGD by 0.7

The One Knob I Never Swept Was the Optimizer. Adam Beat My Tuned SGD by 0.7

A month of paired t-tests over learning rates, schedules, EMA and augmentation — all of it on top of SGD, chosen by reflex and folklore ('SGD generalizes better for convnets'). A proper face-off with per-optimizer tuning at my fixed 10-epoch budget: Adam wins by +0.71, runs quieter across seeds, and — against the second piece of folklore — plain Adam with coupled L2 beats a tuned AdamW.

One Horizontal Flip at Test Time Beat Every Training Trick I've Measured

One Horizontal Flip at Test Time Beat Every Training Trick I've Measured

Test-time augmentation gets dismissed as a Kaggle hack, so I priced it properly: ten paired seeds, four view sets, clean GPU timings. Averaging a prediction with its mirror image gained +0.56 points — seven times what EMA earned, with zero training changes — and the sweep shows the views are wildly unequal: one flip is worth more than four translations combined.

Early Stopping Went 0 for 15 Against 'Just Take the Last Epoch'

Early Stopping Went 0 for 15 Against 'Just Take the Last Epoch'

Best-validation checkpoint selection is such standard practice that I'd never asked whether it helps. Fifteen seeds with per-epoch validation and test curves: the last epoch was the true best epoch in every single run, the validation set's job was reduced to occasionally picking wrong, and the 5,000 images I reserved for it cost more accuracy than any selection could ever recover.

I Warned Against Big IMU Rotations. The Sweep Says I Had It Backwards

I Warned Against Big IMU Rotations. The Sweep Says I Had It Backwards

Last week's augmentation post capped rotation at ±15° with a confident physical argument: rotate further and you teach the model that lying down looks like standing. Today's 300-run dose-response sweep says the cap was wrong — 30° beats 15° on every metric, and even ±90° never hurts. The physical argument was plausible, stated with authority, and untested. Familiar story.

EMA's Popular Default Lost Me 3 Points, and the Control Group Dropped a Bombshell

EMA's Popular Default Lost Me 3 Points, and the Control Group Dropped a Bombshell

Weight averaging is sold as free accuracy, so I measured it with the cleanest experiment this blog has run: two EMA copies maintained inside the same training run, compared against the raw weights they shadow — seed noise cancels exactly. The tutorial default decay lost 3 points in 15 out of 15 runs. The tuned one earned +0.08. And the baseline column quietly rewrote a month of this blog's statistics.

I Said It Would Take Fifty Splits. Here Are the Fifty Splits

I Said It Would Take Fifty Splits. Here Are the Fifty Splits

Last week's IMU augmentation post ended by calling a two-point hint 'a hypothesis worth fifty splits, not a result.' Fifty splits and 200 training runs later: the hypothesis was real but pointed at the wrong augmentation. The one my five-split experiment dismissed as null turns out to be the best thing you can do for your hardest users.

I Went Hunting for the Famous loss.item() Tax and Came Back With Pocket Change

I Went Hunting for the Famous loss.item() Tax and Came Back With Pocket Change

PyTorch folklore says calling .item() every step forces a GPU sync and quietly throttles training. I measured it across five regimes — small model, big model, sub-millisecond steps, torch.compile, CUDA graphs — trying to make the tax appear. The worst I could produce was 7%, and the mechanism explains why the horror stories don't reproduce on modern hardware.

The Most Recommended IMU Augmentation Made My Model Worse in All Five Splits

The Most Recommended IMU Augmentation Made My Model Worse in All Five Splits

Every sensor-data tutorial hands you the same augmentation menu: add noise, scale, rotate. I measured all three on human activity recognition under an honest subject split. Two did nothing detectable. The most popular one — Gaussian jitter — hurt in five out of five splits, and the reason says something about how badly image intuitions transfer to sensors.

Batch 1 Uses 8% of Your GPU, and Other Things the Batching Curve Says

Batch 1 Uses 8% of Your GPU, and Other Things the Batching Curve Says

I swept batch size from 1 to 256 across three model sizes in fp32 and fp16 on an RTX 4080 SUPER. The first eight images are literally free, fp16 is slower than fp32 until batch 16, and the biggest batch is never the fastest one. The whole serving policy falls out of three tables.

The Twenty-Line Test I Kept Promising, and the Tolerance That Makes It Work

The Twenty-Line Test I Kept Promising, and the Tolerance That Makes It Work

Two posts on this blog end by recommending golden-sample tests and then don't show one. Today I built it and measured the only design decision that matters: the tolerance. Legitimate variation moved my logits by at most 0.006; the weakest bug I could inject moved them by 1.15. That 190x gap is where the test lives.

I Tried the Textbook Fixes for Big-Batch Training. All of Them Made It Worse

I Tried the Textbook Fixes for Big-Batch Training. All of Them Made It Worse

Friday's post ended with a confident claim I hadn't tested: that batch 512's 4.5-point accuracy loss 'becomes fixable with properly scaled LR and warmup.' So I tested it. Linear scaling lost 28 points. Warmup alone lost 6.6. The thing that actually helped was refusing to follow the rule at all — and the reason turns out to be printed in the fine print of the paper the rule comes from.

I Ranked Six Training Knobs by How Hard They Actually Hit

I Ranked Six Training Knobs by How Hard They Actually Hit

Yesterday I established that my training pipeline's seed noise is 1.17 percentage points — big enough to drown the tricks people A/B test. So today I measured what ISN'T drowned: six common hyperparameter changes, three seeds each, expressed in units of that noise. The ranking embarrassed me, because the biggest free win was a knob I thought I'd already set correctly.

Your +0.3% Improvement Is Probably a Coin Flip

Your +0.3% Improvement Is Probably a Coin Flip

I trained the identical model 15 times, changing only the random seed, and got accuracies spanning 4.6 percentage points. Then I added a real improvement worth +0.35%p and tried to detect it: a single-seed comparison picked the right winner 59% of the time. Thirty training runs later, some uncomfortable arithmetic about every ablation table I've ever written.

num_workers=4 Made My Training 47% Slower

num_workers=4 Made My Training 47% Slower

Every PyTorch tutorial says to crank up DataLoader workers. On Windows, that advice backfired: 4 workers made each epoch 47% slower than no workers at all, and 8 workers made it 2.4x slower. The fix is one flag that the tutorials, written on Linux, never needed to mention.

CPU Inference Threading: The Default Grabs Every Core and Still Loses

CPU Inference Threading: The Default Grabs Every Core and Still Loses

onnxruntime spreads each inference across all your cores by default. I measured latency against thread count for a 103 KB model and a 43 MB one, then tried eight single-threaded sessions against one default session — and got 1.7x the throughput from the same silicon.

Forget model.eval() and Your Accuracy Depends on Your Traffic

Forget model.eval() and Your Accuracy Depends on Your Traffic

The most famous two lines in PyTorch inference, measured in their absence: train-mode batch norm scores exactly chance on single requests and looks nearly fine at batch 256 — which is why load tests can't catch it. Plus what no_grad actually buys (hint: not speed).

Quantization Cost My Model 0.13 Points. Preprocessing Bugs Cost Up to 72

Quantization Cost My Model 0.13 Points. Preprocessing Bugs Cost Up to 72

I injected the classic image preprocessing mistakes — BGR order, missing normalization, wrong stats, JPEG artifacts, resize errors — into a controlled pipeline one at a time and measured exactly what each one costs. The ranking is not what code reviews optimize for.

I Set Every Seed and Trained Twice. The Models Diverged at Step 1

I Set Every Seed and Trained Twice. The Models Diverged at Step 1

torch.manual_seed is not reproducibility. I measured how fast two identically-seeded runs drift apart on GPU, why it happens, and what bit-exact determinism actually costs — 16%, not the 2x folklore claims.

From Sensor Windows to a 100 KB Model: Deploying the HAR CNN

From Sensor Windows to a 100 KB Model: Deploying the HAR CNN

Part three of the activity recognition series: exporting the 1D CNN to ONNX, quantizing it to int8, and checking whether every trap from my earlier quantization post fires again on a completely different architecture. (It does, on schedule.)

I Trained 60 Models to Find Out Where Activity Recognition Actually Fails

I Trained 60 Models to Find Out Where Activity Recognition Actually Fails

Full leave-one-subject-out on UCI HAR, as promised: the 94% model is a 99.5% model with one blind spot, 86% of all errors are a single activity pair, and a calibration trick recovers half the gap for the worst users.

Your Activity Recognition Model Isn't 94% Accurate. For Someone, It's 74%

Your Activity Recognition Model Isn't 94% Accurate. For Someone, It's 74%

I finally put numbers behind the train/test split advice I gave in my IMU preprocessing post — random vs. subject splits on real sensor data, 10 trained models, and a per-user accuracy spread that matters more than the leakage I went looking for.

My GPU Stopped Throwing OOM Errors. What It Does Instead Is Worse

My GPU Stopped Throwing OOM Errors. What It Does Instead Is Worse

I pushed ResNet50 batches past 16 GB expecting a crash and got a silent 45x slowdown instead — Windows' sysmem fallback in action. Plus real numbers for the two levers that actually buy you bigger batches: gradient checkpointing and accumulation.

torch.compile on Windows Isn't Supposed to Work. Here's What I Got Anyway

torch.compile on Windows Isn't Supposed to Work. Here's What I Got Anyway

PyTorch's compiler officially has no Windows GPU story — no Triton wheels, dead on arrival. With a community wheel, a version pin, and a MAX_PATH workaround, I got it running and timed what it's actually worth.

channels_last: 1.4x Faster in bf16, 4x Slower in fp16, on the Same GPU

channels_last: 1.4x Faster in bf16, 4x Slower in fp16, on the Same GPU

The memory-format one-liner behaved exactly as documented with bfloat16 and catastrophically backfired with float16 on my stack. Timings, the forward/backward split that localizes the problem, and the layout gotchas nobody warns you about.

Autocast in Practice: 1.6x Faster, 40% Less Memory, and the 0.35% of Gradients That Vanish

Autocast in Practice: 1.6x Faster, 40% Less Memory, and the 0.35% of Gradients That Vanish

After TF32, the next rung down the precision ladder is fp16/bf16 autocast. I timed it on a ResNet18 training step, then counted exactly how many real gradients underflow to zero — the number that explains why GradScaler exists.

The 'Free Speedup' Flags, Measured: One Did Almost Nothing on My GPU

The 'Free Speedup' Flags, Measured: One Did Almost Nothing on My GPU

Every PyTorch performance checklist says to enable cudnn.benchmark and TF32. I timed both on an RTX 4080 — the famous flag bought 3%, the flag nobody mentions was already on, and TF32's error is 340x larger.

Does Batch-Level GPU Augmentation Hurt Accuracy? I Trained 25 Models to Find Out

Does Batch-Level GPU Augmentation Hurt Accuracy? I Trained 25 Models to Find Out

My last post found that batched GPU transforms give every image in the batch the same random parameters. This one measures what that actually costs on CIFAR-10 — and documents how five seeds nearly fooled me.

I Moved Image Augmentation to the GPU: 13x Faster, With One Catch

I Moved Image Augmentation to the GPU: 13x Faster, With One Catch

torchvision transforms v2 runs batched augmentation on the GPU and crushed my best CPU worker setup — but every image in the batch silently gets the same random crop, jitter, and blur. Measured, as usual.

num_workers on Windows: I Benchmarked the Advice I Gave You Last Week

num_workers on Windows: I Benchmarked the Advice I Gave You Last Week

Every PyTorch tutorial says to raise num_workers. I measured it on a 16-core Windows machine: workers made light pipelines slower, and one overlooked flag mattered more than any worker count.

Quantizing an ONNX Model in Practice: The Numbers Nobody Shows You

Quantizing an ONNX Model in Practice: The Numbers Nobody Shows You

I quantized a real trained model with onnxruntime and measured everything — file size, latency, accuracy. Dynamic quantization made my CNN 3x slower, and that's not even the strangest result.

Preparing IMU Sensor Data for Deep Learning: A Signal Processing Engineer's Guide

Preparing IMU Sensor Data for Deep Learning: A Signal Processing Engineer's Guide

Field notes on turning raw accelerometer and gyroscope streams into something a neural network can actually learn from — timestamps, gravity, windowing, and the data leaks that quietly inflate your accuracy.

What Actually Breaks When You Export PyTorch Models to ONNX

What Actually Breaks When You Export PyTorch Models to ONNX

Four export failures I reproduced on a real machine — fixed batch sizes, silently baked branches, unsupported operators, and a Windows crash you won't guess — with the exact errors and fixes.

Quantization for Edge Devices: Lessons from Deploying on Real Hardware

Quantization for Edge Devices: Lessons from Deploying on Real Hardware

PTQ vs. QAT, memory layouts, and the hardware constraints nobody mentions until deployment day — notes from working with models on embedded targets.

Is Your GPU Actually Busy? Diagnosing CPU-GPU Bottlenecks in PyTorch

Is Your GPU Actually Busy? Diagnosing CPU-GPU Bottlenecks in PyTorch

Why training pipelines stall on data loading more often than on compute, and how to prove it with the PyTorch profiler instead of guessing.

How I Follow AI Without Drowning: A Primary-Source Reading Habit

How I Follow AI Without Drowning: A Primary-Source Reading Habit

The reading workflow I use to keep up with AI as a working engineer — official docs, technical reports, and changelogs instead of secondhand commentary.

Token Efficiency in Practice: Getting More from Every LLM Call

Token Efficiency in Practice: Getting More from Every LLM Call

What building against strict API quotas taught me about prompt design, RAG context control, and structured outputs — with actual token counts instead of hand-waving.

PyTorch vs. JAX: Choosing Your 2026 Deep Learning Framework

PyTorch vs. JAX: Choosing Your 2026 Deep Learning Framework

A practitioner's comparison of PyTorch and JAX in 2026: where each framework actually earns its place, beyond the benchmark headlines.

Why Perplexity is a Vanity Metric for Modern LLM Evaluation

Why Perplexity is a Vanity Metric for Modern LLM Evaluation

Perplexity tells you how well a model predicts tokens, not whether it does the job. A layered evaluation approach that actually catches failures.

A Sane CUDA Toolkit and cuDNN Setup, Step by Step

A Sane CUDA Toolkit and cuDNN Setup, Step by Step

The CUDA and cuDNN installation workflow I settled on after too many broken environments: version matching, paths, and verification that actually catches mistakes.

PyTorch from the Ground Up: Tensors, Autograd, and Modules

PyTorch from the Ground Up: Tensors, Autograd, and Modules

How PyTorch’s three core layers — tensors, autograd, and nn.Module — fit together, plus the habits that have saved me the most debugging time.