
CPU Inference Threading: The Default Grabs Every Core and Still Loses
When I quantized the HAR model and reported 0.033 ms per inference, one detail went unexamined: onnxruntime’s default behavior is to parallelize each single inference across every core in the machine. My desktop has 8 physical cores (16 logical), so that 0.033 ms was sixteen threads’ worth of coordination for a 103 KB model. Whether that’s sensible is a real question with money attached — an inference server’s thread configuration decides how many requests a box actually serves, and an edge device sharing its CPU with the rest of the firmware cares even more. So: latency versus intra_op_num_threads, measured for a small, a smaller, and a big model, plus one serving experiment that changed how I’d configure this in production.
Latency vs. thread count, three model sizes
Batch 1, medians over 500 runs, p99 in parentheses:
| threads | HAR fp32 (374 KB) | HAR int8 (103 KB) | ResNet18 fp32 (43 MB) |
|---|---|---|---|
| 1 | 0.103 (0.157) | 0.038 (0.080) | 28.61 (29.49) |
| 2 | 0.067 (0.106) | 0.032 (0.059) | 14.81 (23.26) |
| 4 | 0.061 (0.165) | 0.027 (0.046) | 11.67 (13.05) |
| 8 | 0.056 (0.137) | 0.034 (0.082) | 6.51 (13.21) |
| 16 | 0.066 (0.270) | 0.034 (0.108) | 6.40 (17.23) |
| default | 0.061 (0.112) | 0.031 (0.043) | 6.45 (7.14) |
Three findings, in increasing order of how much they changed my mind.
First, the big model scales the way the textbook says, with the usual tax: ResNet18 gains 4.4x from eight threads — real, but half of the ideal 8x, because convolution kernels don’t partition for free. Going from 8 threads to 16 buys nothing at the median: my 16 “CPUs” are 8 physical cores with hyperthreading, and two hyperthreads sharing one core’s execution units don’t help math-dense kernels. The plateau at physical core count is textbook too; the number of people (me included) who have pasted logical core counts into thread configs suggests the textbook goes unread.
Second, the tiny models do benefit from threading — I expected pure overhead and measured a real 1.4–1.8x from a few threads — but the winning count is small (4 for the int8 model) and past it things degrade in the metric that matters for serving: p99. At 16 threads the int8 model’s tail latency is 2.3x its 4-thread tail; the fp32 model’s p99 more than doubles versus 2 threads. Median latency plateaus politely; tail latency punishes over-threading. For a 0.03-ms model, sixteen threads is a synchronization lottery run 30,000 times a second.
Third — and this sets up the real experiment — the default configuration is a reasonable single-stream choice for every model here. If you run one inference at a time and want it fast, the default is within noise of the best fixed setting. The problem with the default isn’t latency. It’s what it costs you when requests arrive concurrently.
One big session vs. eight small ones
A serving box doesn’t run one inference at a time; it runs as many as arrive. So, the experiment: HAR int8 model, same machine, three seconds of saturated load, two philosophies. One default session parallelizing each inference across all cores — versus eight sessions pinned to one thread each, running in parallel.
| configuration | throughput |
|---|---|
| 1 session, default threading | 30,376 inf/s |
| 1 session, 1 thread | 20,320 inf/s |
| 8 sessions × 1 thread | 51,361 inf/s |
| 16 sessions × 1 thread | 51,949 inf/s |
Same silicon, 1.7x the throughput, from turning intra-op parallelism off and letting concurrency live at the request level instead. The mechanism is the overhead visible in the first table: splitting one 0.03-ms inference across cores means fork/join synchronization per layer per request, and those sync costs are pure loss when independent requests could have used the cores with no coordination at all. Requests are embarrassingly parallel; layers are not. Sixteen single-threaded sessions add nothing over eight — physical cores are the wall, again, on cue.
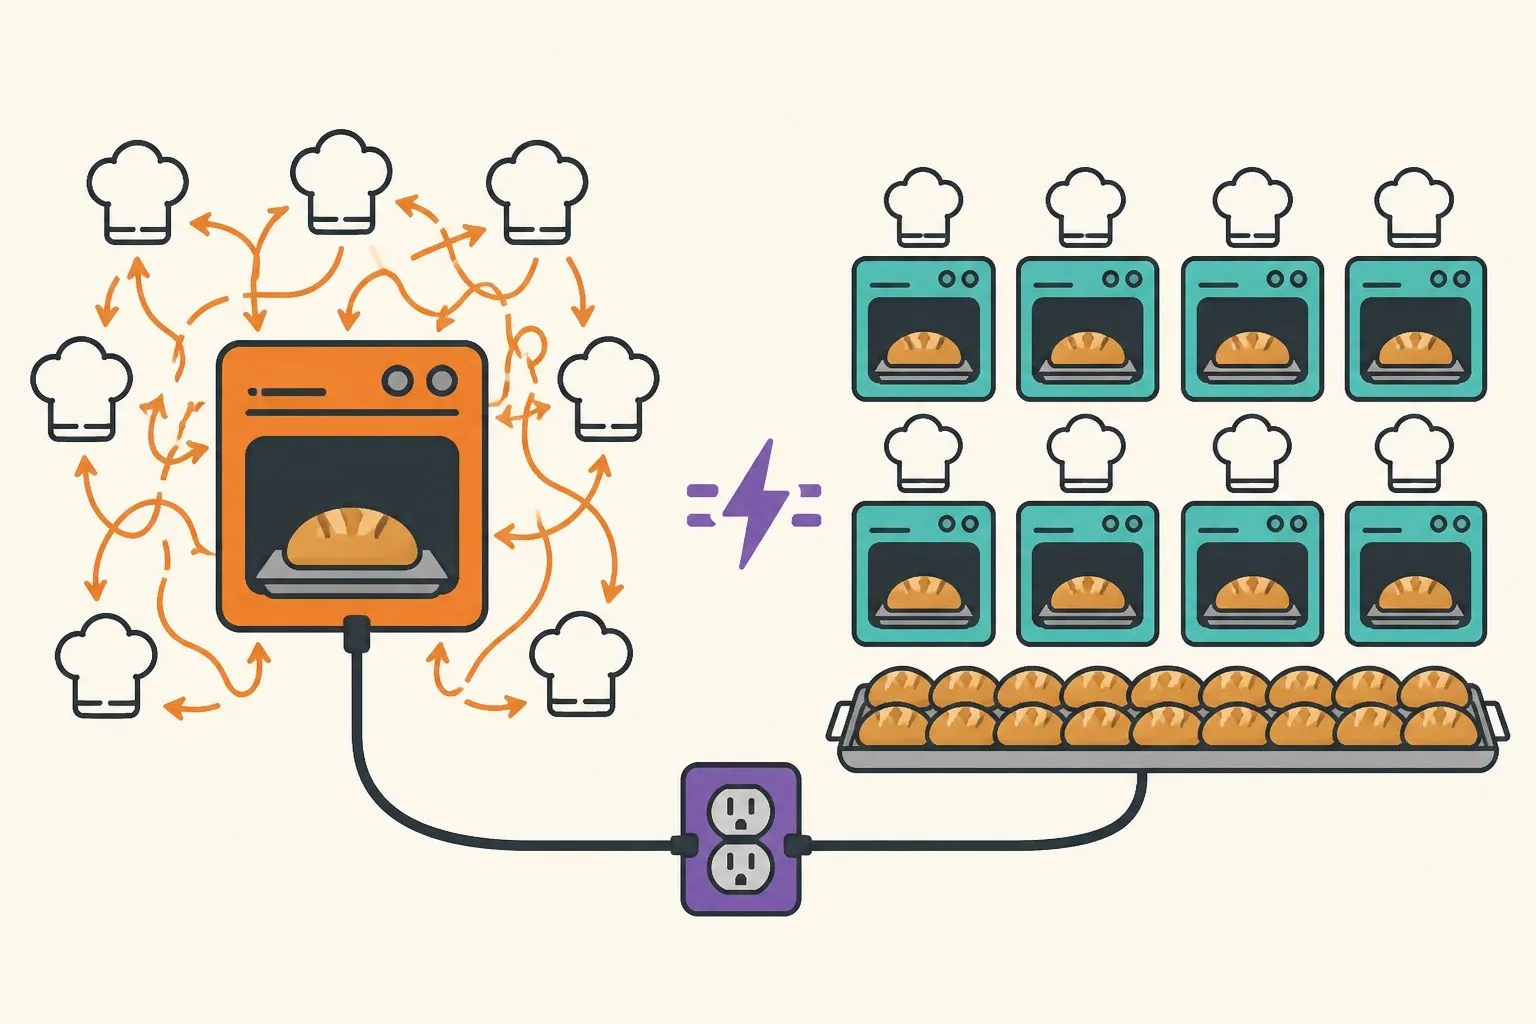
The corollary I’d underline for edge work: the single-threaded configuration also has the smallest and most predictable footprint — no thread pool waking up all cores for every 0.038-ms inference, which on battery-powered hardware is an energy line item, and the p99 penalty of the big thread pool disappears. One thread was never the fastest single-stream option in the table above. It’s still what I’d flash onto a device.
The policy I wrote down
For a single interactive stream on a big model: threads = physical cores, and stop there — logical cores are a decoy that bought 0.1 ms of median and 4 ms of p99 here. For small models: 2–4 threads is the whole show, and the tail gets worse past that. For anything serving concurrent requests: one thread per session, one session per physical core, and take the 1.7x — intra-op parallelism is a latency tool, not a throughput tool, and using it as both is how a box ends up busy and slow simultaneously.
Scope, as always: one CPU (8-core Zen 4), onnxruntime 1.20, batch 1, models from this blog’s own history. The ratios will move on your hardware. But “default = all cores” is a policy someone chose for a benchmark that isn’t your workload — the sweep takes fifteen minutes, and mine paid for itself seventy percent over.